Transformo tus datos en contenido visual de valor
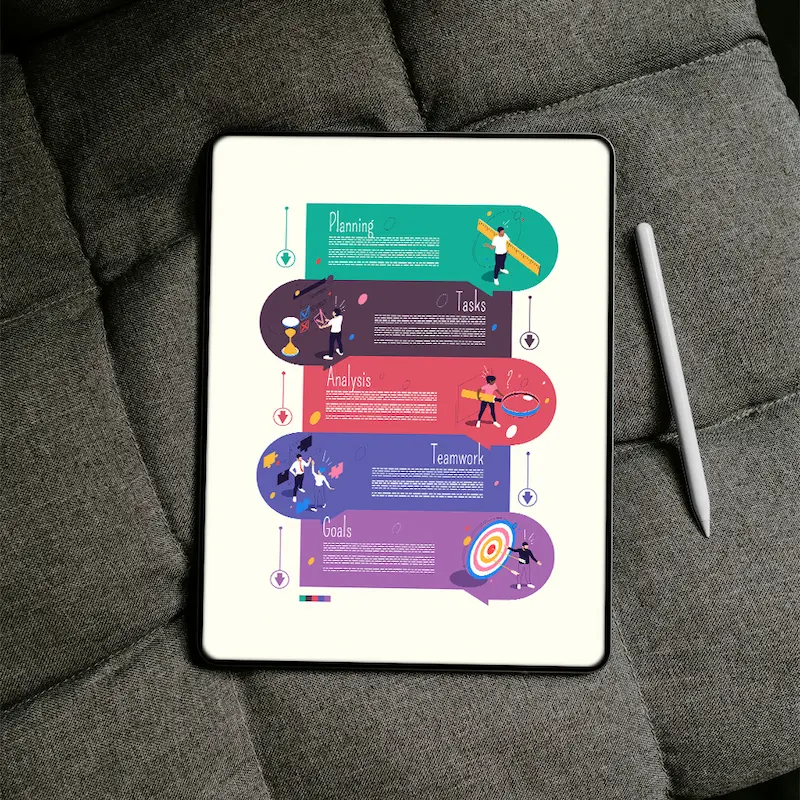
Las infografías se han convertido en una herramienta esencial en la comunicación digital. En un mundo saturado de información, donde la capacidad from atención is limitada, el diseño de infografías emerge como la solución perfecta para transformar datos complejos en contenido visualmente atractivo y fácil de digerir.
Una infografía bien diseñada no solo presenta información, sino que cuenta una historia. Combina texto conciso, gráficos impactantes y una estructura lógica para guiar al lector a través de un tema. Es una poderosa herramienta for the marketing de contenidos, la educación y la divulgación, capaz de captar la atención, aumentar la retención de la información y generar un mayor impacto que un texto plano.
¿Qué puedo diseñar dentro del servicio de diseño de infografías?
Infografías físicas
Creación de archivos preparados para impresión, adaptados al formato que se requiera.
Infografías digitales
Creación de piezas infográficas para contenidos digitales como, presentaciones, webs, etc…
Infografías para redes sociales
Creación de posts de redes sociales con infografías. Formato carroussel, post, vídeo animado, etc…
Animación de infografías
Animación de infografías creadas previamente para un contenido más dinámico.

Price and estimated timeframe
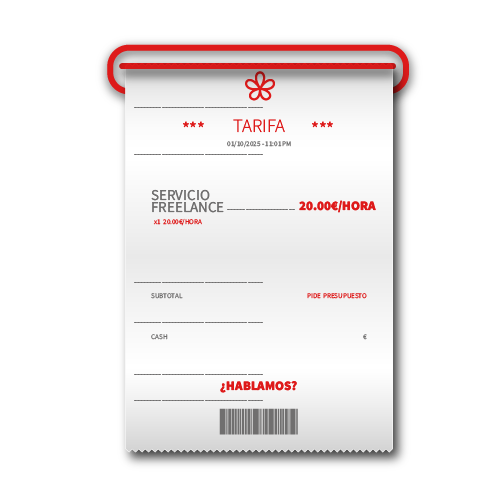
I am currently working with a price/hour from 20 euros for my services as a freelance graphic designer. The final quote will be made once we know the volume of hours and work we have available.
The deadline will always be tied to the volume of the project, the bigger the project, the longer it will take to get it ready. Within this limitation, I will always have it ready as soon as possible for a last revision.

¿Qué incluye el servicio de diseño de infografías?
dISEÑO DE INFOGRAFÍAS DESDE ZERO
El objetivo de nuestro servicio es la conceptualización y design from infografías únicas. No se trata solo de hacer bonitos tus datos; primero, trabajamos en la estructura lógica para que la información fluya y se comprenda al instante. Diseñamos la jerarquía visual, los gráficos personalizados y la paleta de colores para que tu infografía no solo eduque, sino que también refuerce la identidad de tu marca. El resultado es un contenido de alto valor, ideal para marketing de contenidos y link building.
Adaptación a diferentes soportes
Una infografía debe ser versátil. Una pieza que funciona en tu blog puede no ser la adecuada para un reel o para un informe impreso. Nos encargamos de la adaptación de tu infografía a múltiples formatos: versiones largas para web, versiones cuadradas para redes sociales, versiones en formato presentación (PPT/Keynote) e incluso versiones para print. Esto maximiza el alcance de tu contenido y garantiza que tu mensaje sea legible y atractivo en cualquier plataforma.
Entrega de archivos finales
La calidad técnica es tan importante como la visual. Al finalizar el proyecto, te entregamos todos los archivos finales necesarios para que puedas usar tu infografía sin problemas. Esto incluye archivos vectoriales (AI o EPS) para escalado sin pérdida de calidad, archivos de alta resolución (PNG o JPG) optimizados para web y, si lo necesitas, plantillas base. Te garantizamos que la entrega de archivos cumple con los estándares profesionales para cualquier medio.
Preguntas frecuentes
sobre el diseño de infografías
¿Qué es una infografía y por qué la necesito para mi negocio?
Una infografía es una representación visual de datos, información o conocimientos. Se utiliza para simplificar temas complejos, haciendo que la información sea fácil de entender, recordar y compartir.
La necesitas para tu negocio porque te ayuda a:
Mejorar el SEO
Aumentar el tráfico web
Fortalecer tu marca
¿Qué tipos de infografías diseñan?
Diseñamos una amplia variedad de infografías adaptadas a cada necesidad. Los tipos más comunes incluyen:
Infografías estadísticas
Ideales para visualizar encuestas, estudios de mercado y grandes conjuntos de datos.
Infografías cronológicas
Perfectas para mostrar la historia de una empresa o la evolución de un proceso a lo largo del tiempo.
Infografías de proceso
Explican de forma clara y sencilla los pasos para realizar una tarea o el funcionamiento de un servicio.
Infografías de comparación
Útiles para destacar las diferencias y similitudes entre productos, servicios o conceptos.
¿Qué información necesito proporcionarles para empezar?
El tema y los datos
Los datos clave, estadísticas, textos y la información que quieres visualizar. Si la información aún no está estructurada, podemos ayudarte a organizarla.
El público objetivo
Saber a quién te diriges nos ayuda a definir el tono y el estilo visual más adecuado.
Tu identidad de marca
El logo, la paleta de colores corporativos, las tipografías y cualquier guía de estilo que tengamos que seguir.
Ejemplos de infografías que te guste
Esto nos da una idea clara de tus preferencias estéticas.
¿Cuánto tiempo se tarda en diseñar una infografía?
El tiempo de entrega depende de la complejidad y la cantidad de información. Un proyecto estándar suele tardar entre 1 y 2 semanas, desde la recepción de la información hasta la entrega del diseño final. Este proceso incluye las fases de concepto, diseño preliminar, revisiones y arte final.
¿En qué formatos entregan el archivo final?
Entregamos la infografía en formatos optimizados tanto para uso digital como para impresión. Los formatos más habituales son:
PNG o JPG
Para su uso en web, blogs y redes sociales, optimizados para una carga rápida.
Para compartir por correo electrónico o imprimir en alta calidad.
VÍDEO
Para infografías animadas.


